CPU and Memory Profiling
Code profiling is the process of analyzing a program to understand its runtime behavior using performance characteristics like CPU/GPU usage, memory usage, IO operations, and total runtime. Profilers can help developers identify bottlenecks such as high CPU usage, memory usage, and runtime. There are profilers for most languages and environments, but we will focus on Python profiling tools in this guide.
Sampling vs. Deterministic profilers
There are two main types of profilers and you should be aware of the differences between them. For small programs, you may not notice a difference, but for larger programs, the choice of profiler can have a significant impact on the performance of your program.
- Deterministic (event-based)
- Can have high overhead
- Trace every function call
- Python ex: cprofile, time, line_profiler, memray
- Sampling (statistical)
- Sample the stack periodically
- Non deterministic
- Add less overhead
- Python ex: austin, pyinstrument, py-spy
Python and iPython/Jupyter profilers
Let's test out these tools with a sample program (random_primes_sum.py) that is CPU and memory intensive:
import random
import math

def random_primes_sum():
    random_list = [random.uniform(1, 10000) for _ in range(1000000)]
    sorted_list = sorted(random_list)
    transformed_list = [math.sqrt(x) + math.log(x) for x in sorted_list]
    def is_prime(n):
        if n <= 1:
            return False
        for i in range(2, int(math.sqrt(n)) + 1):
            if n % i == 0:
                return False
        return True
    return sum(1 for x in transformed_list if is_prime(int(x)))

random_primes_sum()
time
- Simple single run timer
- iPython magics
%timeand%%time - Useful for long running operations
- Minimal overhead
- Output can vary due to current system load and other factors (see timeit for accurate averaged timing)
In [1]: %time random_primes_sum()
Out[1]: CPU times: user 521 ms, sys: 26.2 ms, total: 547 ms
        Wall time: 560 ms
timeit
- Multiple run timer
- Useful when operation is fast and you want to average over several runs for accurate timing
- iPython magics
%timeitand%%timeit - Configurable flags such as #iterations, precision, and saving output to variable (see the ipython docs for all flags)
- Can also be used on python scripts (see python docs for examples)
Watch out for operations that modify a global state such as `file.read()` or `list.sort()`. E.g. `%timeit arr.sort()` will display an inaccurate timing since the list will be sorted in-place on the first iteration, then subsequent iterations will be near instant.
In [1]: %timeit random_primes_sum()
Out[1]: 525 ms ± 10.4 ms per loop (mean ± std. dev. of 7 runs, 1 loop each)
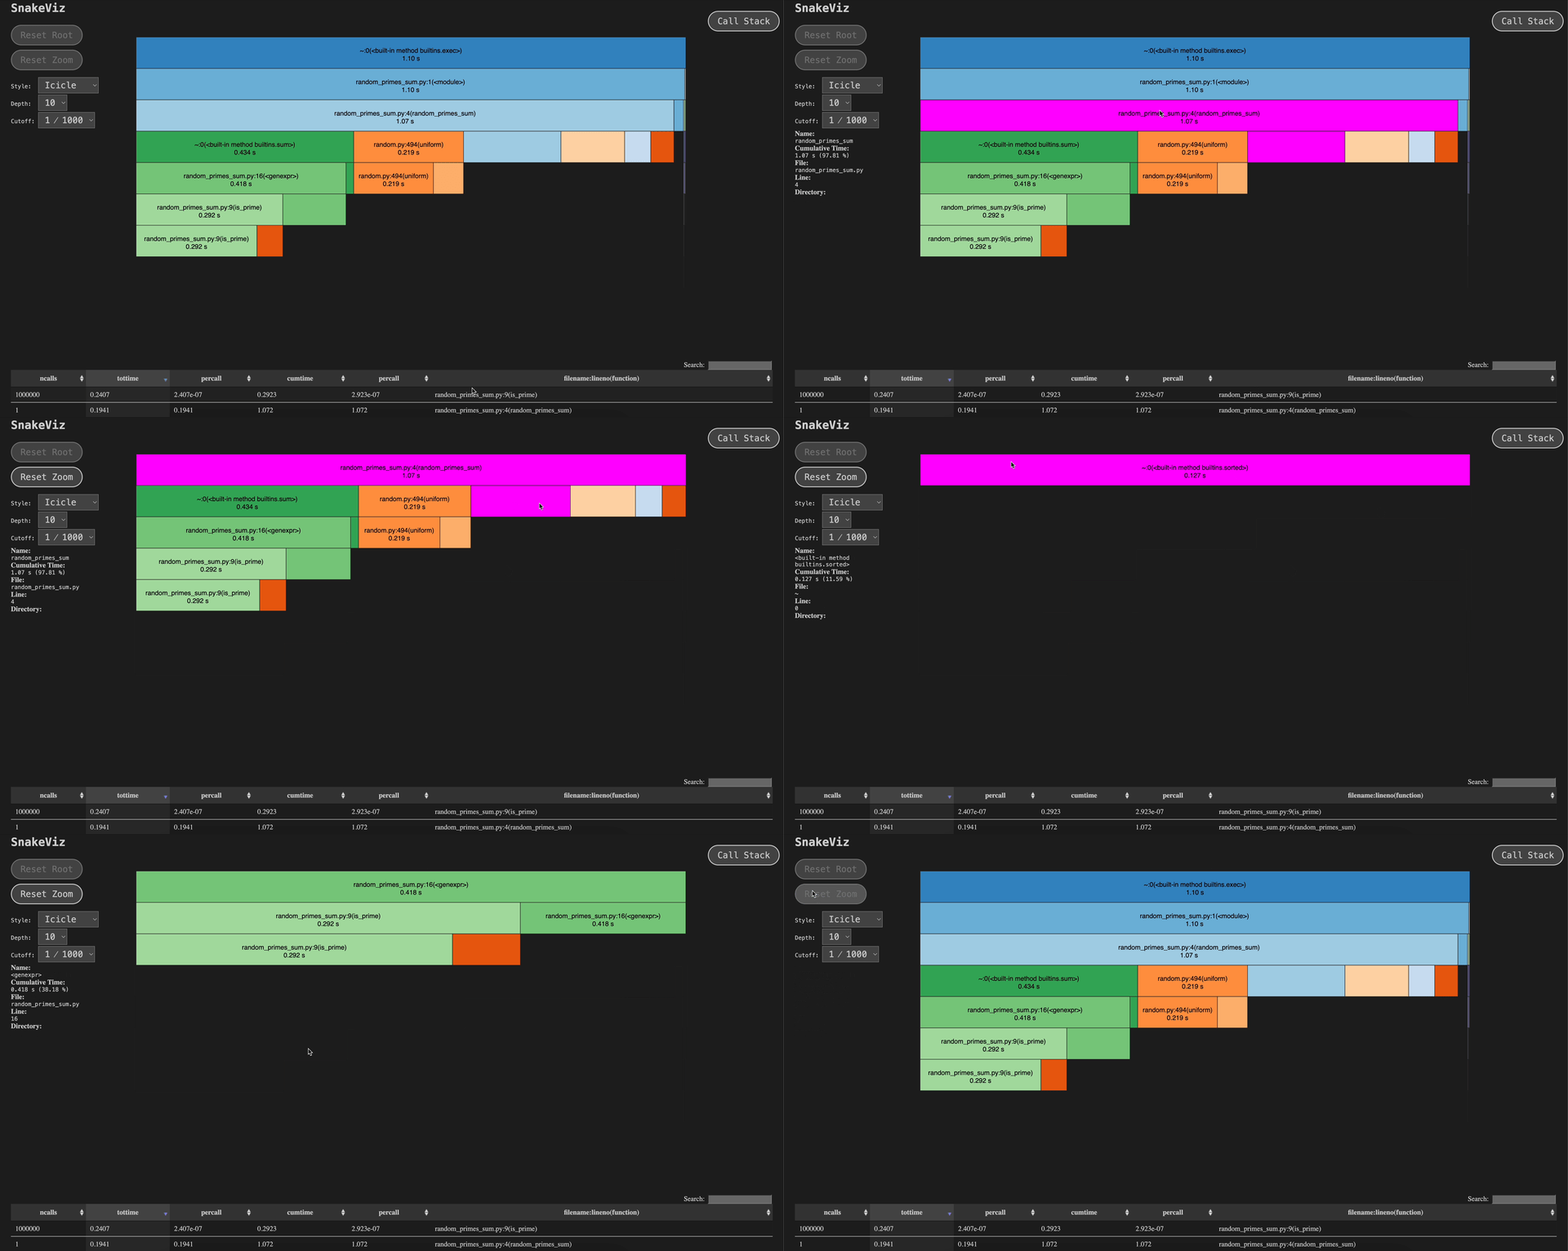
cProfile/snakeviz
- Built-in Python profiler
- Shows time spent in functions and number of times functions were called
- Configurable flags such as sort key and save to file (see the python docs for more)
          6236608 function calls (6236576 primitive calls) in 1.177 seconds

   Ordered by: cumulative time

   ncalls  tottime  percall  cumtime  percall filename:lineno(function)
      3/1    0.000    0.000    1.177    1.177 {built-in method builtins.exec}
        1    0.029    0.029    1.177    1.177 random_primes_sum.py:1(<module>)
        1    0.211    0.211    1.143    1.143 random_primes_sum.py:4(random_primes_sum)
        1    0.017    0.017    0.462    0.462 {built-in method builtins.sum}
   235305    0.137    0.000    0.445    0.000 random_primes_sum.py:16(<genexpr>)
  1000000    0.256    0.000    0.309    0.000 random_primes_sum.py:9(is_prime)
  1000000    0.169    0.000    0.234    0.000 random.py:494(uniform)
        1    0.134    0.134    0.134    0.134 {built-in method builtins.sorted}
  1999892    0.099    0.000    0.099    0.000 {built-in method math.sqrt}
  1000000    0.066    0.000    0.066    0.000 {method 'random' of '_random.Random' objects}
  1000002    0.055    0.000    0.055    0.000 {built-in method math.log}
prun
- Built-in iPython CPU profiler
- Shows time spent in functions and number of times functions were called
- Configurable flags such as line limits, sort key, and save to file (see the ipython docs for all flags)
- Output file can also be visualized using snakeviz
In [1]: %prun random_primes_sum()
Out[1]:          6235352 function calls (6235341 primitive calls) in 1.288 seconds

   Ordered by: internal time
   List reduced from 159 to 10 due to restriction <10>

   ncalls  tottime  percall  cumtime  percall filename:lineno(function)
  1000000    0.304    0.000    0.371    0.000 3958871235.py:8(is_prime)
   234761    0.177    0.000    0.549    0.000 3958871235.py:15(<genexpr>)
  1000000    0.176    0.000    0.241    0.000 random.py:494(uniform)
        1    0.175    0.175    1.157    1.157 3958871235.py:4(random_primes_sum)
        1    0.141    0.141    0.141    0.141 {built-in method builtins.sorted}
  1999913    0.120    0.000    0.120    0.000 {built-in method math.sqrt}
  1000000    0.065    0.000    0.065    0.000 {method 'random' of '_random.Random' objects}
  1000000    0.055    0.000    0.055    0.000 {built-in method math.log}
      2/1    0.025    0.013    1.182    1.182 <string>:1(<module>)
        1    0.019    0.019    0.567    0.567 {built-in method builtins.sum}
line_profiler/lprun
- Line-by-line profiling version of
prun - Can be easier to read and understand than
prun - Helps optimize specific lines of code that are slow
In [1]: %load_ext line_profiler
In [2]: %lprun -f random_primes_sum random_primes_sum()
Out[2]: Timer unit: 1e-09 s

Total time: 1.44482 s
File: /var/folders/wb/v7frq16s6nnb0tkx5j8nz06r0000gn/T/ipykernel_96884/3958871235.py
Function: random_primes_sum at line 4

Line #      Hits         Time  Per Hit   % Time  Line Contents
==============================================================
     4                                           def random_primes_sum():
     5   1000001  361745000.0    361.7     25.0      random_list = [random.uniform(1, 10000) for _ in range(1000000)]
     6         1  138950000.0    1e+08      9.6      sorted_list = sorted(random_list)
     7   1000001  203757000.0    203.8     14.1      transformed_list = [math.sqrt(x) + math.log(x) for x in sorted_list]
     8         1       1000.0   1000.0      0.0      def is_prime(n):
     9                                                   if n <= 1:
    10                                                       return False
    11                                                   for i in range(2, int(math.sqrt(n)) + 1):
    12                                                       if n % i == 0:
    13                                                           return False
    14                                                   return True
    15         1  740362000.0    7e+08     51.2      return sum(1 for x in transformed_list if is_prime(int(x)))
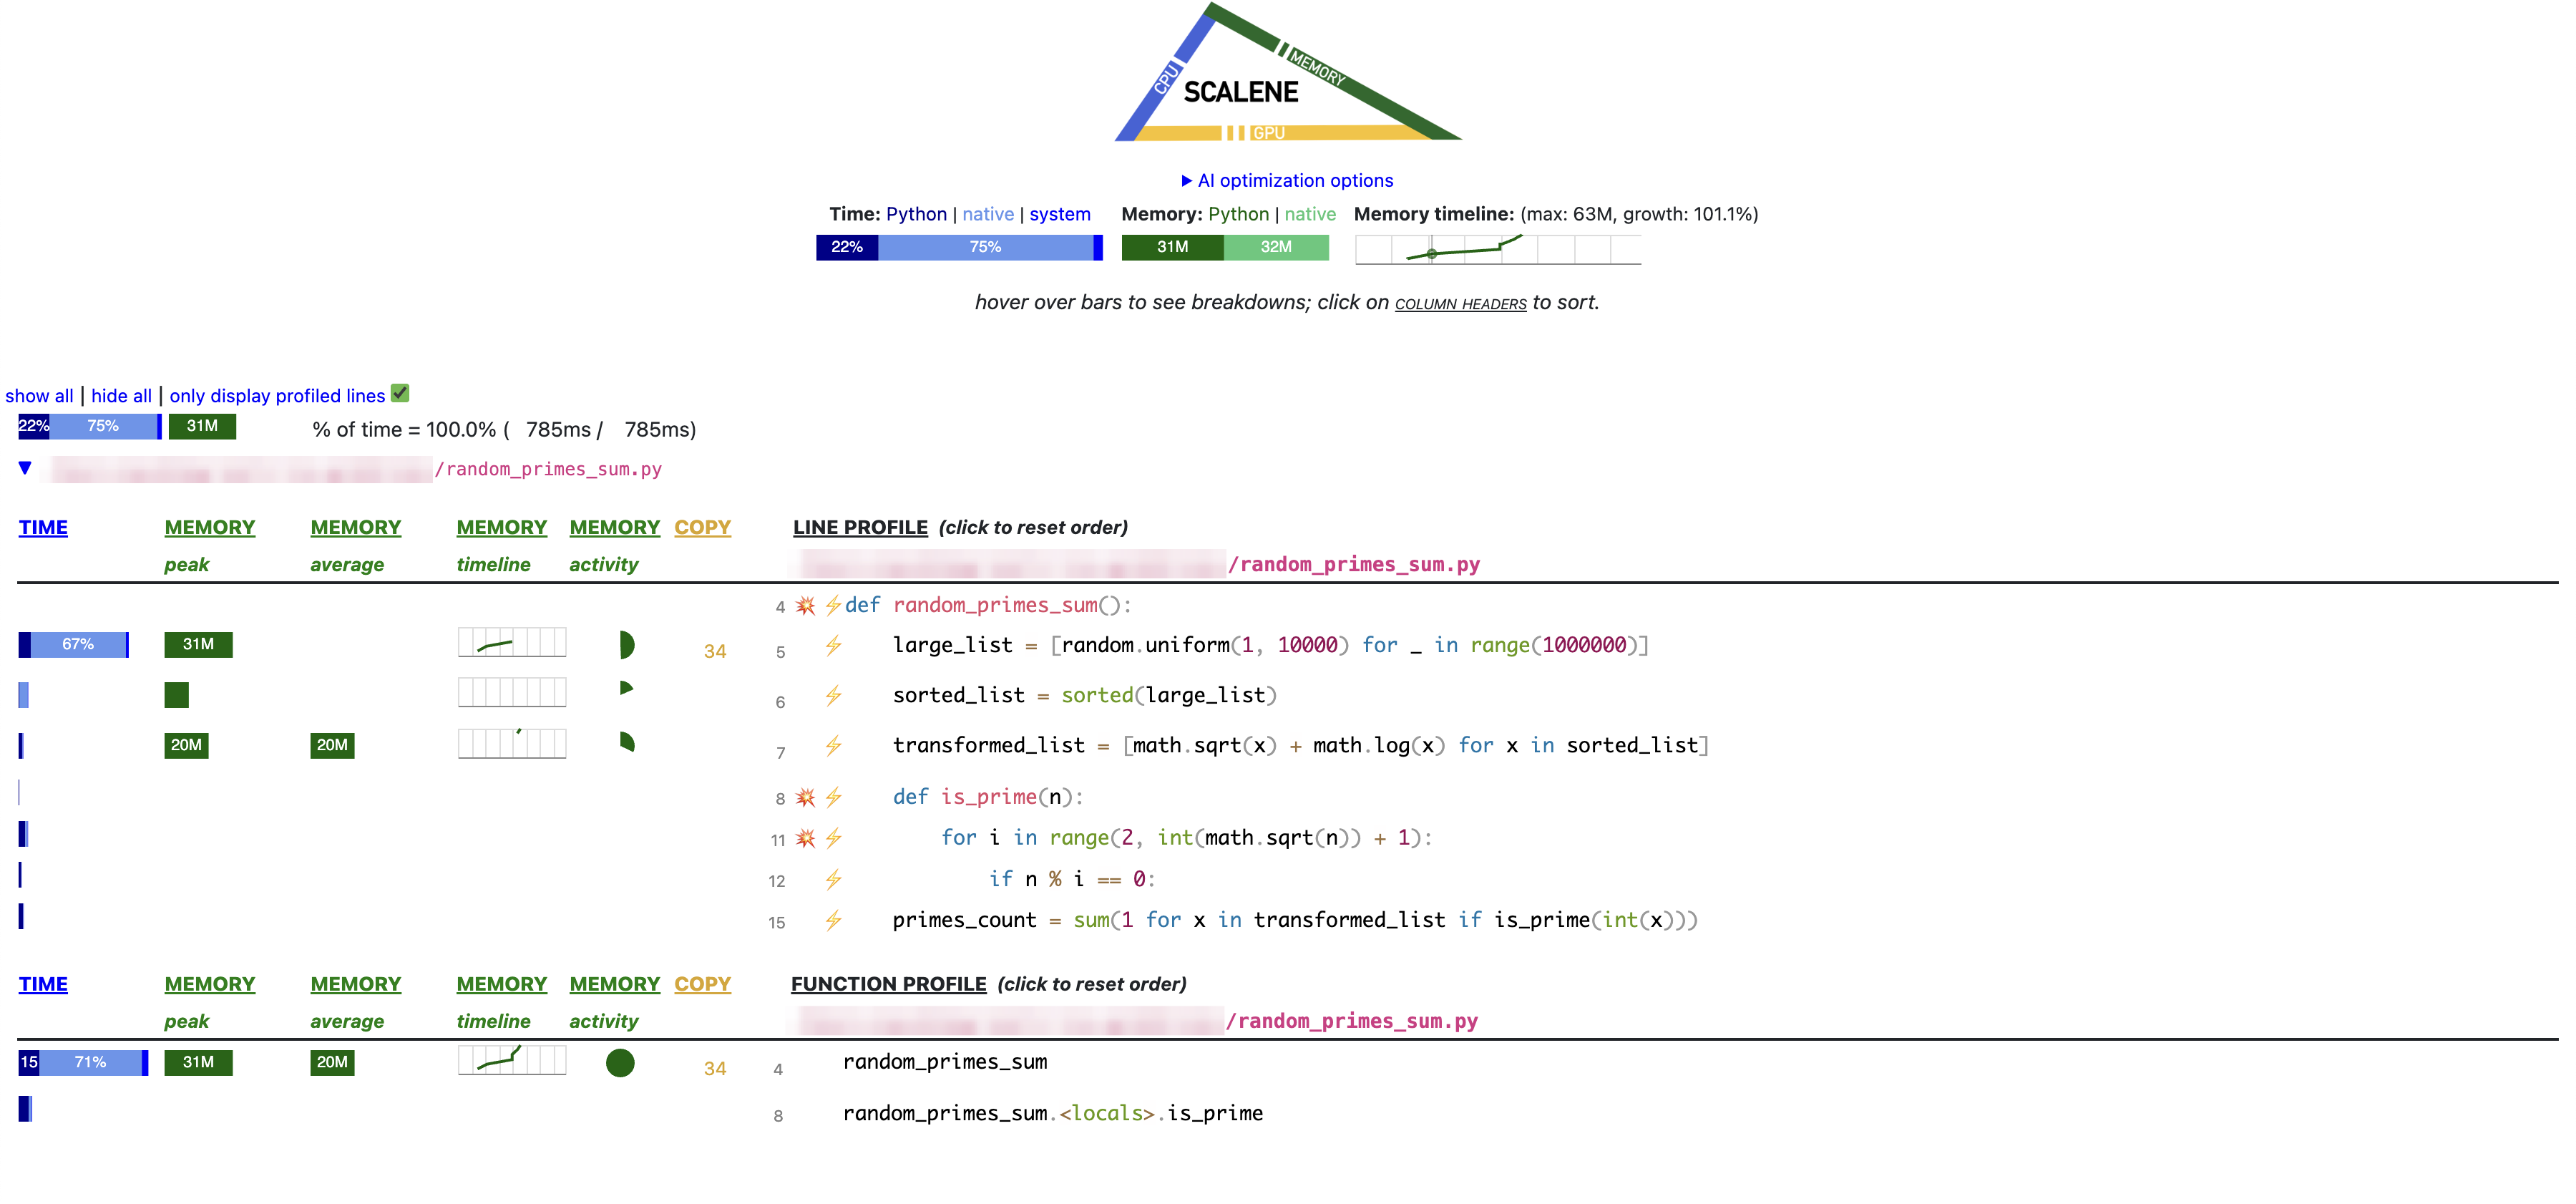
Scalene
- Github homepage
- CPU, memory, and GPU profiler
- Low overhead
- Easy to visualize with web GUI
- Pytest support (profiles functions not each parametrized test)
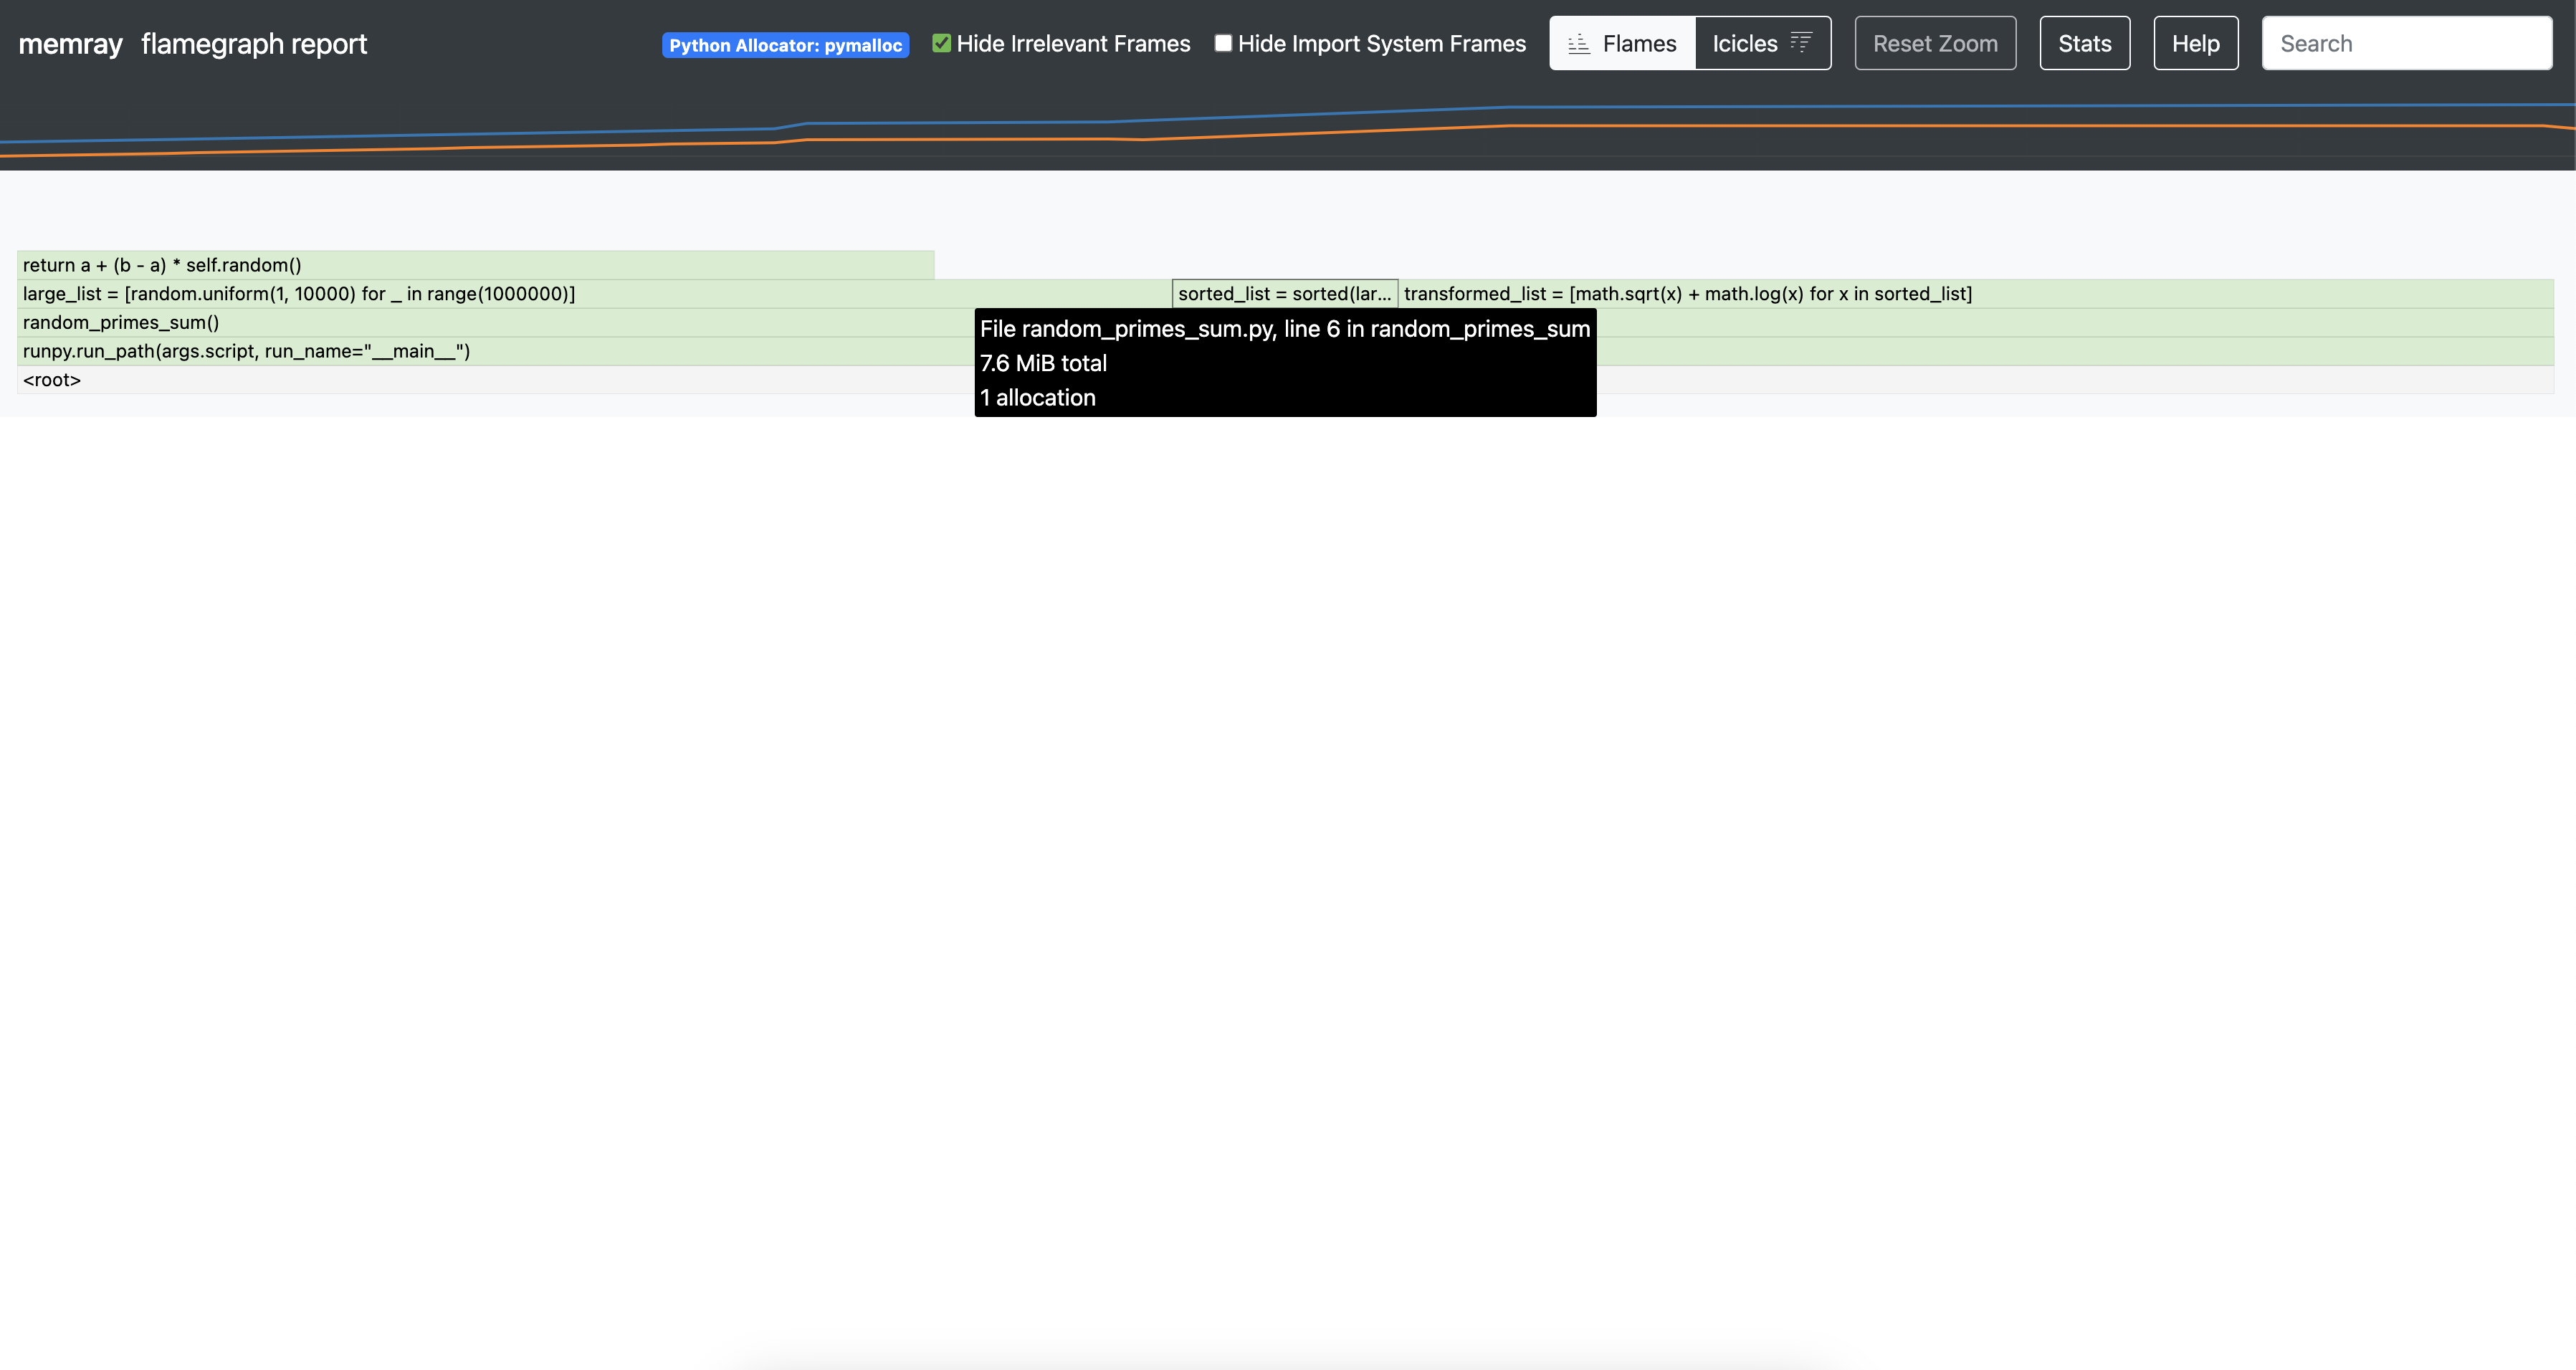
Memray
- Homepage
- Powerful open source memory profiler developed by Bloomberg Engineering
- Provides detailed memory usage information, flame graphs, and more visualizations
- Live memory usage tracking
- Excellent pytest plugin
- Note: Memray only works on Linux and MacOS
import random
import math
import pytest

def random_primes_sum(range_size):
    large_list = [random.uniform(1, range_size / 10) for _ in range(range_size)]
    sorted_list = sorted(large_list)
    transformed_list = [math.sqrt(x) + math.log(x) for x in sorted_list]
    def is_prime(n):
        if n <= 1:
            return False
        for i in range(2, int(math.sqrt(n)) + 1):
            if n % i == 0:
                return False
        return True
    primes_count = sum(1 for x in transformed_list if is_prime(int(x)))
    return primes_count

@pytest.mark.parametrize("range_size", [1000000, 10000000])
def test_random_primes_sum_parametrized(range_size):
    result = random_primes_sum(range_size)
    assert isinstance(result, int)
    assert result >= 0
...
====================================================================================================================================== MEMRAY REPORT ======================================================================================================================================
Allocation results for test_random_primes_sum.py::test_random_primes_sum_parametrized[10000000] at the high watermark

         📦 Total memory allocated: 828.3MiB
         📏 Total allocations: 5
         📊 Histogram of allocation sizes: |▄ █|
         🥇 Biggest allocating functions:
                - random_primes_sum:test_random_primes_sum.py:8 -> 392.0MiB
                - random_primes_sum:test_random_primes_sum.py:6 -> 360.0MiB
                - random_primes_sum:test_random_primes_sum.py:7 -> 76.3MiB


Allocation results for test_random_primes_sum.py::test_random_primes_sum_parametrized[1000000] at the high watermark

         📦 Total memory allocated: 84.7MiB
         📏 Total allocations: 5
         📊 Histogram of allocation sizes: |▄ █|
         🥇 Biggest allocating functions:
                - random_primes_sum:test_random_primes_sum.py:6 -> 39.1MiB
                - random_primes_sum:test_random_primes_sum.py:8 -> 38.1MiB
                - random_primes_sum:test_random_primes_sum.py:7 -> 7.6MiB


=================================================================================================================================== 2 passed in 11.72s ====================================================================================================================================